A benchmark of two KV cache formats on Gemma-4-31B, and what the numbers actually mean for people who use long context.
The problem that started this
I do a lot of code review with an LLM. Most of it runs through CRIA, a stateful agent that intelligently front-loads context so the model actually knows what it’s looking at. That’s the grown-up version. The version I’m about to describe is the un-grown-up version: you chat for a while to build up context, the model learns your codebase conventions, then you paste in a file and ask “find the bug.” Somewhere along the way, the conversation gets long. You paste the next file. The model answers confidently. You ship.
Here’s what I eventually noticed: sometimes the review was confidently wrong about parts of the file it had never actually seen. Not a hallucination in the usual sense — the model hadn’t made up facts about code that existed. It had made up facts about code that had been silently truncated before it ever reached the model. The window filled up. The tail of my file fell off the end. Nothing errored, nothing warned me, and the answer came back looking normal.
This is not a speed problem. It’s a “did the model actually see my file” problem. And it’s the worst kind of bug: invisible, intermittent, confident.
So I wanted to know two things about my RTX 5090 setup:
- How much context can I actually use? Not theoretical max, but: what fits on 32 GB of VRAM alongside the model weights, given reasonable KV cache compression?
- If I use that much context, does the model still actually attend to it? A 250k-token window is useless if recall falls off a cliff at 150k.
This post is what I found, running Gemma-4-31B (Q4_K_XL) on an RTX 5090 with ik_llama.cpp, comparing two KV cache formats: standard q8_0 and ik_llama.cpp’s turbo3. Plus a needle-in-haystack recall test to check whether the long context is actually usable, not just loadable.
What’s actually in your GPU’s memory?
Before we can compare cache formats, we need a mental model of what a GPU is holding when an LLM is running. It’s not just “the model.” There are three things competing for your 32 GB of VRAM:
┌─────────────────── 32 GB VRAM ───────────────────┐
│                                                  │
│  MODEL WEIGHTS         ~18 GB                    │
│  ───────────────                                 │
│  The trained parameters of Gemma-4-31B.          │
│  Frozen. Loaded once. Never change.              │
│                                                  │
├──────────────────────────────────────────────────┤
│                                                  │
│  KV CACHE              grows with context        │
│  ─────────                                       │
│  A running summary of every token the model      │
│  has seen in the current conversation.           │
│  Read in full on every generated token.          │
│                                                  │
├──────────────────────────────────────────────────┤
│                                                  │
│  Activations & buffers  ~1–2 GB                  │
│                                                  │
└──────────────────────────────────────────────────┘
Model weights are the network itself — 31 billion numbers that define how Gemma “thinks.” They’re quantized to roughly 4 bits each in the Q4_K_XL format, which is why the whole model fits in ~18 GB instead of ~60 GB. Once loaded, weights just sit there.
The KV cache is where things get interesting. Every time the model reads a token — whether it’s in your prompt or something it just generated — it computes a “key” and “value” vector for that token, at every layer, and stores them. The next time the model has to compute attention (which is every time it generates a token), it reads all of those stored vectors. The cache grows linearly with context length, and it’s read over and over and over during generation.
At 131,000 tokens of context, with standard 8-bit KV quantization, the cache is roughly 8 GB on Gemma-4-31B. At 262,000 tokens it would be 16 GB — almost as large as the model itself. At 16-bit precision (uncompressed), it would be more than 30 GB and wouldn’t fit on a 32 GB card at all.
That’s the whole reason KV cache quantization exists. The model weights aren’t the thing that bursts your VRAM budget at long context. The cache is. And anything you do to shrink the cache — store it at lower precision, compress it — directly buys you more context.
> Under the hood: Gemma-4-31B uses grouped-query attention. The per-token KV footprint is roughly 2 × n_kv_heads × head_dim × n_layers × bytes_per_entry. At 8-bit that works out to ~64 KB per token; × 131072 tokens ≈ 8 GB. At 16-bit it’s 16 KB per token × 131072 ≈ 16 GB, but that’s just for half the current test context — full f16 at 262k is >30 GB, which is why the experiment you’re about to read literally cannot be run with f16 KV on this GPU.
Two jobs: prefill and decode
When you send a prompt to an LLM, the GPU does two very different things, one after the other:
 Your prompt (all tokens at once)        Model generates, one token at a time
 ─────────────────────────────          ──────────────────────────────────────
 "Please review this file ..."           "I"  "see"  "a"  "bug"  "on"  "line 12"
            │                              │     │    │    │    │     │
            ▼                              ▼     ▼    ▼    ▼    ▼     ▼
      ╔═════════════╗                 ╔════════════════════════════════╗
      ║  PREFILL    ║                 ║          DECODE                ║
      ║  phase      ║                 ║          phase                 ║
      ╠═════════════╣                 ╠════════════════════════════════╣
      ║ processes   ║                 ║ generates tokens one by one;   ║
      ║ all N input ║                 ║ for each new token, reads the  ║
      ║ tokens in   ║                 ║ entire KV cache back from VRAM ║
      ║ parallel    ║                 ║                                ║
      ╠═════════════╣                 ╠════════════════════════════════╣
      ║ compute-    ║                 ║ memory-bandwidth-              ║
      ║ bound       ║                 ║ bound                          ║
      ╠═════════════╣                 ╠════════════════════════════════╣
      ║ measured    ║                 ║ measured in                    ║
      ║ in PP t/s   ║                 ║ TG t/s                         ║
      ╚═════════════╝                 ╚════════════════════════════════╝
Prefill is what happens when the model “reads” your prompt. It runs every token of your input through the network in parallel, builds the KV cache for all of them, and then waits for you to ask for the first output token. This phase is bottlenecked by raw compute — the GPU is doing giant matrix multiplications and its cores are the limit. Benchmark metric: PP t/s (prompt-processing tokens per second).
Decode is what happens after prefill, when the model is generating. For each new token, the model computes attention against the entire KV cache — every key and value vector for every token in the context. Then it produces one token, appends its own K and V to the cache, and repeats. This phase is bottlenecked by memory bandwidth — most of decode is the GPU streaming KV cache bytes out of VRAM. Compute cores are often mostly idle; what matters is how fast bytes can arrive. Benchmark metric: TG t/s (token-generation tokens per second).
Why does the prefill/decode distinction matter for us? Because KV cache quantization affects the two phases differently. Anything that makes the KV cache smaller should help decode (less data to stream). Anything that makes the kernel that reads the cache more complex should hurt decode (more work per byte). The net effect is what we want to measure.
What are q8_0 and turbo3?
Both are lossy compressions for the KV cache. Fewer bits per number stored means a smaller cache in VRAM, which means more context fits on the same card.
- q8_0 is the standard 8-bit format that ships with stock llama.cpp. Each KV entry is stored with roughly 8 bits of precision, plus a small shared scale. It’s mature, well-optimized, and has high-quality CUDA kernels behind it.
- turbo3 is a KV cache format specific to the
ik_llama.cppfork. It’s smaller than q8_0 per token — the whole point is to unlock context lengths that q8_0 can’t reach. But “smaller” comes with a cost: the kernel has to do more work to decompress each entry on the fly.
A useful analogy: imagine q8_0 is your photos saved at normal JPEG quality. turbo3 is the same photos saved at higher JPEG compression — smaller files, but every time you open one, the computer has to do a little more work to render it back. The question for benchmarking is whether that extra rendering work is cheap (so you get the space savings for free) or expensive (so you pay in speed for the space).
> Worth being precise: turbo3 is a KV cache format, not a weight-repacking format. It does not touch the model weights on disk. It only controls how the runtime key/value tensors are stored in VRAM. This is a common point of confusion — there are other ik_llama.cpp features (like runtime weight repacking) that are unrelated and sit at a different layer of the stack.
How I measured (and the gotcha that nearly ruined it)
Hardware: RTX 5090, 32 GB VRAM. Linux host.
Software: ik_llama.cpp fork built with turbo3 support, plus llama-benchy 0.3.5 as the benchmark client.
Model: gemma-4-31B-it-UD-Q4_K_XL.gguf — Gemma-4 31B, instruction-tuned, Q4_K_XL weight quantization.
Context: 131,072 tokens for the head-to-head benchmark — the largest round number that q8_0 can fit on this GPU alongside the weights and overhead. For the needle test, the turbo3 runs used 262,144 tokens.
Depths tested: 0, 8k, 32k, 65k, 131k for throughput; 32k through 250k for recall.
The gotcha
The first round of numbers I collected were garbage. Not obviously garbage — they looked plausible, had tight variance, told a coherent story. They were still wrong, and the story they told would have been actively misleading if I’d published it.
The reason: llama-server’s default flags are not benchmark-safe.
Two specific defaults conspire against you. --ctx-checkpoints (with a non-zero default) keeps rolling snapshots of the KV state in host memory. --checkpoint-every-n-tokens writes checkpoint state during prefill. Every large prompt inflates its own measured latency by a chunk of checkpoint-write overhead that has nothing to do with the model itself. On long-context runs, the checkpoints also accumulate across requests and can OOM-kill the server outright (which is how I eventually noticed them — a 9-checkpoint pile-up ate 21 GB of host RAM and the Linux OOM killer stepped in).
If you’re benchmarking llama-server, the following flags are mandatory for honest numbers:
--no-cache-prompt
--ctx-checkpoints 0
--checkpoint-every-n-tokens -1
--cache-ram 0
--parallel 1
All numbers in this post come from runs with those flags set. Every pair of runs in the head-to-head used identical flags; the only thing that differed between the q8_0 run and the turbo3 run was --cache-type-k and --cache-type-v. The full server command template:
./build/bin/llama-server -m gemma-4-31B-it-UD-Q4_K_XL.gguf \
  --host 0.0.0.0 --port 8080 \
  --ctx-size 131072 --n-gpu-layers 99 \
  --cache-type-k  --cache-type-v  \
  --flash-attn on \
  --no-cache-prompt --ctx-checkpoints 0 \
  --checkpoint-every-n-tokens -1 --cache-ram 0 --parallel 1
And one more small lesson: after starting the server, I check that it actually runs at the context I told it to: curl http://host:port/props and verify n_ctx. Launch flags aren’t a guarantee. I got caught by this once.
Throughput: q8_0 vs turbo3, apples to apples
Here are the clean numbers from llama-benchy, both formats, identical flags, same model, ctx 131k, 3 runs per cell:
| depth | q8_0 PP (t/s) | turbo3 PP (t/s) | q8_0 TG (t/s) | turbo3 TG (t/s) |
|---|---|---|---|---|
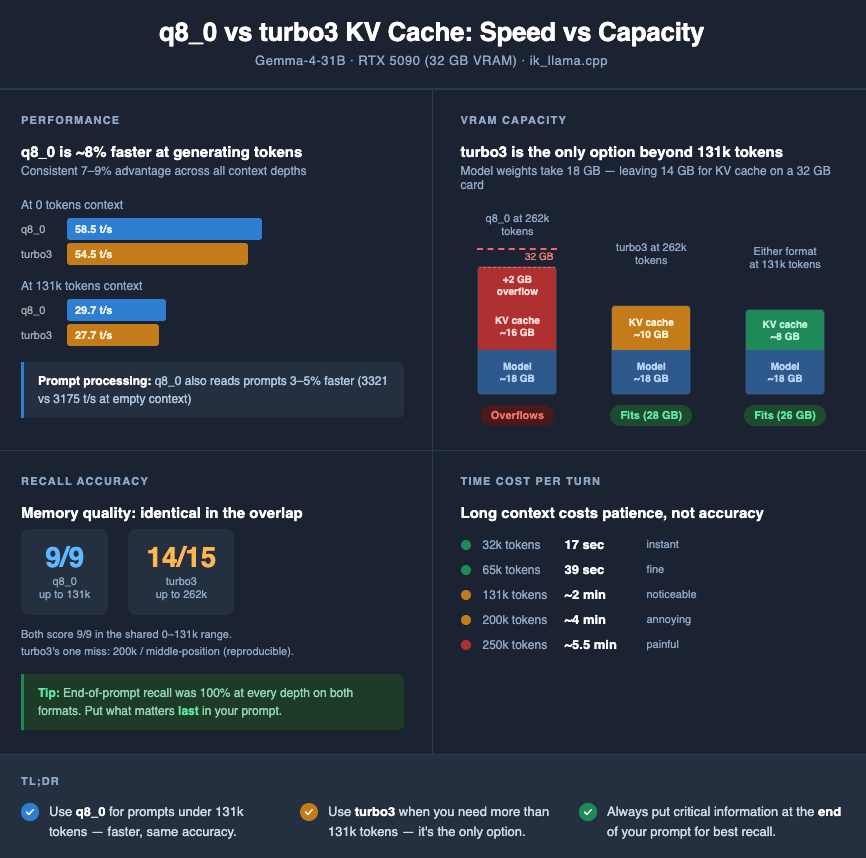
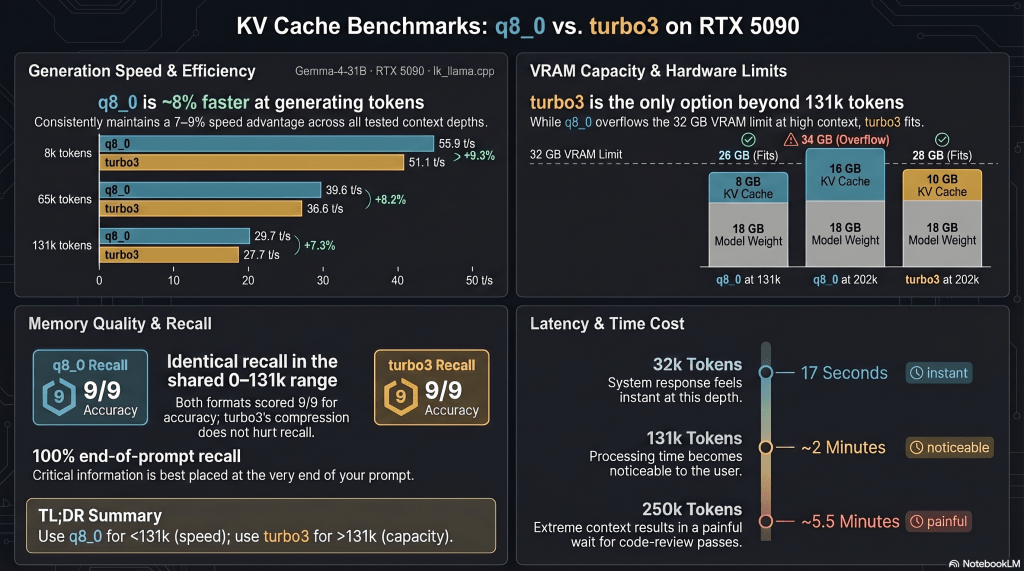
| 0 | 3321.2 | 3175.2 | 58.51 | 54.45 |
| 8k | 3275.9 | 3135.7 | 55.91 | 51.14 |
| 32k | 2775.8 | 2681.9 | 47.54 | 43.73 |
| 65k | 2194.4 | 2128.9 | 39.63 | 36.58 |
| 131k | 1522.1 | 1490.4 | 29.70 | 27.69 |
The TG side visualized:
Decode throughput (TG t/s) — higher is faster

depth  │ q8_0                          turbo3
──────┼─────────────────────          ──────────────────
  0   │ ██████████████████ 58.5       ████████████████▊ 54.5
  8k  │ █████████████████▊ 55.9       ███████████████▊  51.1
  32k │ ███████████████    47.5       █████████████▌    43.7
  65k │ ████████████▌      39.6       ███████████▌      36.6
 131k │ █████████▌         29.7       █████████         27.7
q8_0 is faster everywhere. PP by 2–5%, TG by 7–9%. The gap is consistent and reproducible (standard deviations across the 3 runs are tiny — ±0.1 t/s or less on TG at most depths).
The PP gap is small and probably comes from the slightly different computational shape of attention with a q8_0 vs turbo3 cache during prefill. The TG gap is more interesting and more revealing.
Here’s why the decode result is counterintuitive. turbo3’s KV cache is smaller per token than q8_0’s. Decode is memory-bandwidth-bound — the GPU spends most of its time streaming KV bytes out of VRAM. So a smaller cache should stream faster and win the decode race at long context. Instead, q8_0 wins decode by ~8% at every depth, including 131k where KV cache pressure is highest.
The only way that can happen is if turbo3’s dequantization kernel — the code that decompresses KV entries as they’re read — is eating the bandwidth savings with extra compute. On Blackwell, with this model and this build, the math works out such that “less data to read, but slower to read each byte” nets out to “slightly slower overall.” A different GPU, a different model, or a different build could flip that result.
So the naive pitch — “turbo3 is smaller, therefore turbo3 is faster for long context” — does not survive contact with measurement. turbo3 is smaller. That’s the real thing it buys you. Speed is not the story.
> One more thing worth noting: I’d be curious whether the gap narrows or flips on a GPU with less compute headroom relative to bandwidth (e.g., a 4090 or a mid-range datacenter card), or on a bigger model where decode is more thoroughly bandwidth-starved. On the 5090, compute is plentiful enough that the dequant cost is absorbable but not free. The 7–9% gap is tight enough that minor kernel optimizations on the turbo3 side could close it — which would make the story purely about VRAM, which it arguably already is.
Recall: does the model actually use the context?
Throughput tells you how fast. It doesn’t tell you whether the model is using the context you’re giving it. For that you need a recall test.
The classic test is needle-in-a-haystack: take a long document, insert a random fact somewhere inside it, then ask the model what the fact was. If the model finds it, you know attention actually reached that point in the context. If it doesn’t, you know the long context is nominal — you loaded it, but the model isn’t really looking at it.
I ran a simple version. The haystack is the Gutenberg edition of The Adventures of Sherlock Holmes (which benchy had already cached — convenient). The needle is:
> The secret passphrase is purple-elephant-7294. Remember this passphrase exactly.
I insert that needle at three positions — 5% into the document, 50% in, and 95% in — at five different context depths. For each combination I ask the model: “What is the secret passphrase mentioned somewhere in the text above?” and check whether the exact string purple-elephant-7294 appears in the response.
Both models were gemma-4-31b running with reasoning enabled (more on that later). Both runs used max_tokens=4096 to give the model’s reasoning trace enough room to finish. The only difference was the KV format.
Here are the two grids:
 q8_0 @ 131k ctx                turbo3 @ 262k ctx
 ──────────────────             ──────────────────
 depth    5%  50%  95%          depth    5%  50%  95%
  32k     ✓    ✓    ✓            32k     ✓    ✓    ✓
  65k     ✓    ✓    ✓            65k     ✓    ✓    ✓
 125k     ✓    ✓    ✓           131k     ✓    ✓    ✓
                                 200k     ✓    ✗    ✓
                                 250k     ✓    ✓    ✓

 9/9 = 100%                      14/15 = 93%
Two things to notice.
In the overlapping range — depths where both formats fit — recall is identical. q8_0 gets 9 out of 9; turbo3 gets 9 out of 9. There is no measurable quality cost to turbo3 at depths both can reach. If you were worried that turbo3’s compression was going to quietly degrade attention quality (I was), this result is the answer: it doesn’t, at least not enough to show up in a straightforward recall test.
turbo3 unlocks 200k and 250k, which q8_0 literally cannot reach on this hardware. There is no q8_0 comparison row to put next to turbo3’s 200k and 250k numbers. The --ctx-size 262144 q8_0 server wouldn’t even start; it would run out of VRAM before finishing the KV allocation. So this isn’t turbo3 winning at long context — it’s turbo3 existing at long context while q8_0 doesn’t.
The one miss (turbo3 @ 200k / middle position) is worth an honest aside, and it turned out to be weirder than I initially thought. The model didn’t just fail to find the passphrase; it spent its entire 4096-token reasoning budget listing Sherlock Holmes story titles and describing what it was reading, never converging on “scan for the thing that says secret passphrase”. When I first saw it I assumed it was a noisy one-off and ran the same query three more times, expecting at least one pass. All three reruns failed — in exactly the same way. Same elapsed time to within two seconds. Same finish_reason=length. Same 4096 completion tokens. Same 12,607 characters of reasoning. Same Sherlock Holmes story-title recitation, word for word. At temperature=0 with no prompt caching this is expected — an LLM given identical inputs produces identical outputs — but it turns “the model missed once” into “this specific prompt at this specific depth deterministically puts the model in a reasoning trap it cannot climb out of.” The pathology is reproducible.
Here’s the twist, though: at 250k middle position — longer context, in principle harder — the model passed cleanly. If turbo3 had a systematic middle-of-long-context attention problem, 250k should be worse than 200k, not better. It isn’t. So this isn’t “the format breaks past 131k” and it isn’t “Gemma loses attention at depth.” It looks more like a local minimum specific to how the Sherlock Holmes corpus happens to tile at exactly 200,000 tokens relative to the needle — a combination of haystack content, prompt framing, and context length that happens to lock the model into a particular reasoning trace. A different haystack, a different needle position, or a slightly different prompt would almost certainly dodge it.
I’m not going to pretend the miss isn’t real. It is: 0 for 3, deterministic, and the model spends roughly five minutes of wall-clock time each run chasing its own tail through Victorian mystery titles. But it’s a single-prompt pathology, not an attention-quality cliff, and the adjacent cells at 250k all passed.
End-of-context recall was 100% at every depth for both formats. That’s not a coincidence — it’s the well-known recency bias of transformer attention. Information near the end of the context is easy for the model to attend to; information buried in the middle is harder. The practical implication is a free win: put the file you actually want reviewed at the end of your prompt, not buried in the middle. If your code review workflow arranges things so the file under review is the last thing before the question, you’re in the 100%-recall zone across every depth we tested.
The real cost of long context is your patience
The throughput numbers tell you how many tokens per second you get. The meaningful number, if you’re actually using long context in a workflow, is how long you wait per turn. Here’s what the needle test actually looked like end to end:
Wall-clock per long-context query (reasoning model, one turn):

  32k   ▓  17 sec                       instant
  65k   ▓▓▓  39 sec                     fine
 131k   ▓▓▓▓▓▓▓  2 min (~135 sec)       noticeable
 200k   ▓▓▓▓▓▓▓▓▓▓▓▓▓  4 min (~230 sec) annoying
 250k   ▓▓▓▓▓▓▓▓▓▓▓▓▓▓▓▓▓▓  5.5 min     painful
At 250k tokens, one code review turn is roughly five and a half minutes of waiting. That’s not the model being broken; that’s the physics of running a 31B-parameter reasoning model over a quarter-million tokens of input on a single consumer GPU. Prefill alone takes several minutes at that size, and then the reasoning trace has to decode thousands of tokens at ~19 t/s.
The meaningful headline, if you’re planning to use turbo3 to unlock long context in practice, is not “will the model find my code?” — it’s “am I willing to wait five minutes for each iteration?” For exploratory back-and-forth review, probably not. For a one-shot “read this whole thing and tell me what’s broken” pass on a large file, maybe. Your patience is the bottleneck, not your VRAM.
Does this rule generalize? A Qwen data point
Before wrapping up I wanted at least one other model in the picture — one that would tell me whether “turbo3 costs 8% decode speed” is a property of turbo3 itself or a property of turbo3-meets-Gemma specifically. So I ran the same head-to-head on Qwen3.5-27B-Q4_K_M.gguf — a different architecture, a smaller weight footprint (~15.6 GB instead of ~18 GB), same RTX 5090, same clean-flags template, same depths.
Two things immediately became obvious.
First, on Qwen, q8_0 reaches 262k context by itself. Qwen-27B is small enough (~2.5 GB smaller on disk than Gemma-4-31B) that q8_0’s KV cache at 262k fits inside the VRAM budget alongside the weights. The Gemma-style “q8_0 hits a wall at 131k, turbo3 is the only way past it” situation simply does not occur here. Turbo3 has no unique capacity to offer. If you’re running Qwen at any context length up to 262k, q8_0 is an option.
Second, turbo3’s decode penalty on Qwen is not 8%. It’s much worse, and it scales with depth.
| depth | q8_0 TG (t/s) | turbo3 TG (t/s) | turbo3 penalty |
|---|---|---|---|
| 0 | 69.6 | 67.4 | −3.2% |
| 32k | 55.5 | 47.4 | −14.5% |
| 65k | 46.0 | 36.4 | −20.9% |
| 131k | 34.8 | 25.0 | −28.1% |
| 200k | 28.0 | 19.1 | −31.9% |
| 250k | 24.6 | 16.3 | −33.8% |
At empty context the gap is small. By 250k, turbo3 is a third slower than q8_0. And the gap grows monotonically with context depth — exactly the shape you’d expect if turbo3’s per-byte dequantization cost is higher on Qwen’s attention layout, and that extra cost is being paid on every cache read during decode, which accumulates as the KV cache grows.
This is not silent fallback. If turbo3 had quietly reverted to q8_0 on Qwen, the numbers would be identical, not 34% apart. turbo3 actually engaged. It just happens to be materially slower on this architecture.
The takeaway is not “turbo3 is bad on Qwen.” It’s narrower and more interesting than that: turbo3’s decode cost is a property of how well its kernel’s fast paths match your specific model’s attention shape, and it can vary from “barely noticeable” (Gemma, ~8% flat) to “substantial and growing with depth” (Qwen, up to 34%). You cannot port a turbo3 benchmark from one model to another. The Gemma number and the Qwen number are both real, and both measured on the same GPU with the same build on the same day.
Which also sharpens the practical rule from Section 11 one more time:
> Use turbo3 only when you’ve empirically confirmed that q8_0 can’t fit your target context on your hardware and that turbo3’s decode cost on your specific model is something you can live with. Neither of those is architecture-universal. Measure both.
For Qwen3.5-27B on a 5090, q8_0 answers both questions in your favor at any depth up to 262k, and the answer is just “use q8_0.”
Aside: Gemma-4 is a reasoning model
One thing I didn’t know when I started this experiment and had to learn mid-way: gemma-4-31b-it ships with internal reasoning. In chat completions responses, the model returns two fields — content (the final answer) and reasoning_content (the chain-of-thought). If you set max_tokens to a small number, you can burn the entire budget on reasoning before the model ever produces a final answer, and your response looks like an empty string.
This matters for benchmarking and for long-context use. At long context, the reasoning trace grows — the model has more to think about — and a max_tokens=512 cap that would be fine at short context will cut the answer off mid-thought at 131k+. I settled on max_tokens=4096 as a safe budget for this test. In day-to-day use, if your long-context queries are returning empty or truncated answers, check whether your client is capping output tokens too aggressively.
Practical rules
The data supports a simple operational rule, and it matches my intuition before I started but for slightly different reasons than I expected:
-
If your context is ≤131k tokens, use
q8_0. It’s faster (by ~8% on TG, ~3% on PP), it has identical recall quality, and you avoid turbo3’s occasional long-context reasoning-pathology cases. There is no reason to prefer turbo3 in this range on this hardware. -
If your context needs to exceed ~131k tokens, use
turbo3. It’s the only option on a 32 GB card for a 31B Q4 model. Recall is 93% in our grid and 100% in the common case of end-of-context retrieval. The real cost is wait time per turn, not attention quality. -
Arrange your prompts so the content you actually care about sits at the end. Recency bias is free accuracy. Every end-position test passed at every depth, for both formats, across the full 32k–250k range. If you’re doing code review, put the file under review after your conversation history and before your question. If you’re summarizing, put the main document last. Your attention stack will thank you.
-
Budget your
max_tokensgenerously for reasoning models at long context. 4096 is a reasonable floor. At 200k+ it’s still not always enough, but it survives the common cases. -
If you’re benchmarking
llama-serveryourself, set the clean-flags template from Section 5. Default flags will give you numbers that look plausible and are wrong in ways you cannot see without a controlled comparison.
Loose ends and things I didn’t test
Being honest about what this post doesn’t cover:
-
Only one model. All of these results are Gemma-4-31B at Q4_K_XL. A higher-quality weight quantization (Q5_K_XL, Q6, Q8) might shift the turbo3-vs-q8_0 balance, especially the recall comparison. A different architecture (Qwen, for instance, has different attention structure and different per-token KV sizes) could tell a meaningfully different story. Both are on my list for a follow-up.
-
Only one GPU. The 5090’s balance of compute vs bandwidth is what drove the “turbo3 is slower despite being smaller” result. On a GPU with less compute headroom, or on a larger model that’s more thoroughly bandwidth-starved during decode, the gap could close or flip. If you have different hardware, don’t assume my numbers transfer — run the clean-flags template on your own box.
-
The 200k/middle pathology is deterministic, not intermittent, but it’s also just one prompt. I verified the same query fails 3/3 at
temperature=0, but I didn’t try a different haystack or a different needle position to see whether the trap is specific to this exact input or a broader 200k effect. It could be either; I haven’t ruled out either. -
Mixed K/V. It’s possible to run
--cache-type-k q8_0 --cache-type-v turbo3or vice versa. Whether that’s a “best of both worlds” configuration or a weird chimera is an open question I deliberately didn’t answer here. -
Benchy uses the GPT-2 tokenizer as a fallback when it can’t load the real tokenizer for Gemma-4-31B from HuggingFace. That’s fine for comparing two configurations of the same model (which is what I did), but it would make cross-model comparisons misleading if I tried to directly compare, say, Gemma token-per-second numbers against Qwen’s.
None of that changes the practical rule. It does mean the rule is scoped to “this model, this GPU, this build of ik_llama.cpp.” Run the experiment on your own setup if you care about getting it right.
Summary in one paragraph
If you’re running Gemma-4-31B Q4_K_XL on an RTX 5090 and your context fits in 131k tokens, use q8_0 for the KV cache — it’s measurably faster and indistinguishable from turbo3 on recall. If you need more than 131k tokens of context, use turbo3 — it’s the only format that fits, its recall holds up reasonably well to 250k, and the real cost at those depths is wall-clock wait time (minutes per turn), not model quality. Always put the content you actually want the model to focus on at the end of your prompt; end-of-context recall was perfect across every depth I tested. And if you’re benchmarking llama-server, disable prompt cache, checkpoints, and cache-ram before you trust any of your numbers.
Reproduce this
If you want to run the same benchmark on your own hardware, here’s what you need.
Throughput benchmark:
llama-benchy0.3.5 as the client- The clean
llama-servercommand from Section 5 (copy it verbatim, swap--cache-type-k/--cache-type-vfor the format you want to test) llama-benchy --base-url http://host:port --model gemma-4-31b --pp 2048 --tg 128 --depth 0 8192 32768 65536 131072 --runs 3
Recall test (needle-in-haystack):
needle_test.py— the main script: https://github.com/ankit-appy/llm-benchmark/blob/main/needle_test.py. Self-contained, ~170 lines of Python (requires only therequestslibrary). Reuses the Gutenberg corpus thatllama-benchycaches, inserts the passphrase at 5%/50%/95% positions at your chosen depths, uses/v1/chat/completions(not raw/completion— gemma-4 is instruction-tuned and needs the chat template), reads bothcontentandreasoning_content, and scores by exact substring match. Important: budgetmax_tokens=4096or higher at long context, and leave headroom in your target depth so input + output fits within the server’s--ctx-size.needle_200k_triple.py— the little script: https://github.com/ankit-appy/llm-benchmark/blob/main/needle_200k_triple.py, I used to verify that the 200k/middle pathology was deterministic rather than noisy. Runs the same single query three times back-to-back attemperature=0. If you’re chasing a similar reproducibility question, it’s a useful template.
The gotcha checklist — before you trust any number coming out of llama-server:
--no-cache-prompt
--ctx-checkpoints 0
--checkpoint-every-n-tokens -1
--cache-ram 0
--parallel 1
And always verify the server is actually running at the context size you asked for: curl http://host:port/props and check n_ctx. Launch flags are not a guarantee.
Benchmarks: llama-benchy 0.3.5. Needle test: 15 queries per run against /v1/chat/completions, passphrase injected at 5%/50%/95% positions, scored by exact substring match on combined content + reasoning_content. All raw data (including the dirty first-round numbers I did not use here) is preserved if you want to pick it apart.

Leave a comment